5 days
Earlier stress visibility window

From hidden stress to measurable recovery in one operational cycle.
Trusted by turf operations across Canada
What Changes Immediately
5 days
Earlier stress visibility window
5
Vegetation/thermal layers per scan
100%
Canadian processing and storage
r=0.97
Drone-to-ground correlation benchmark
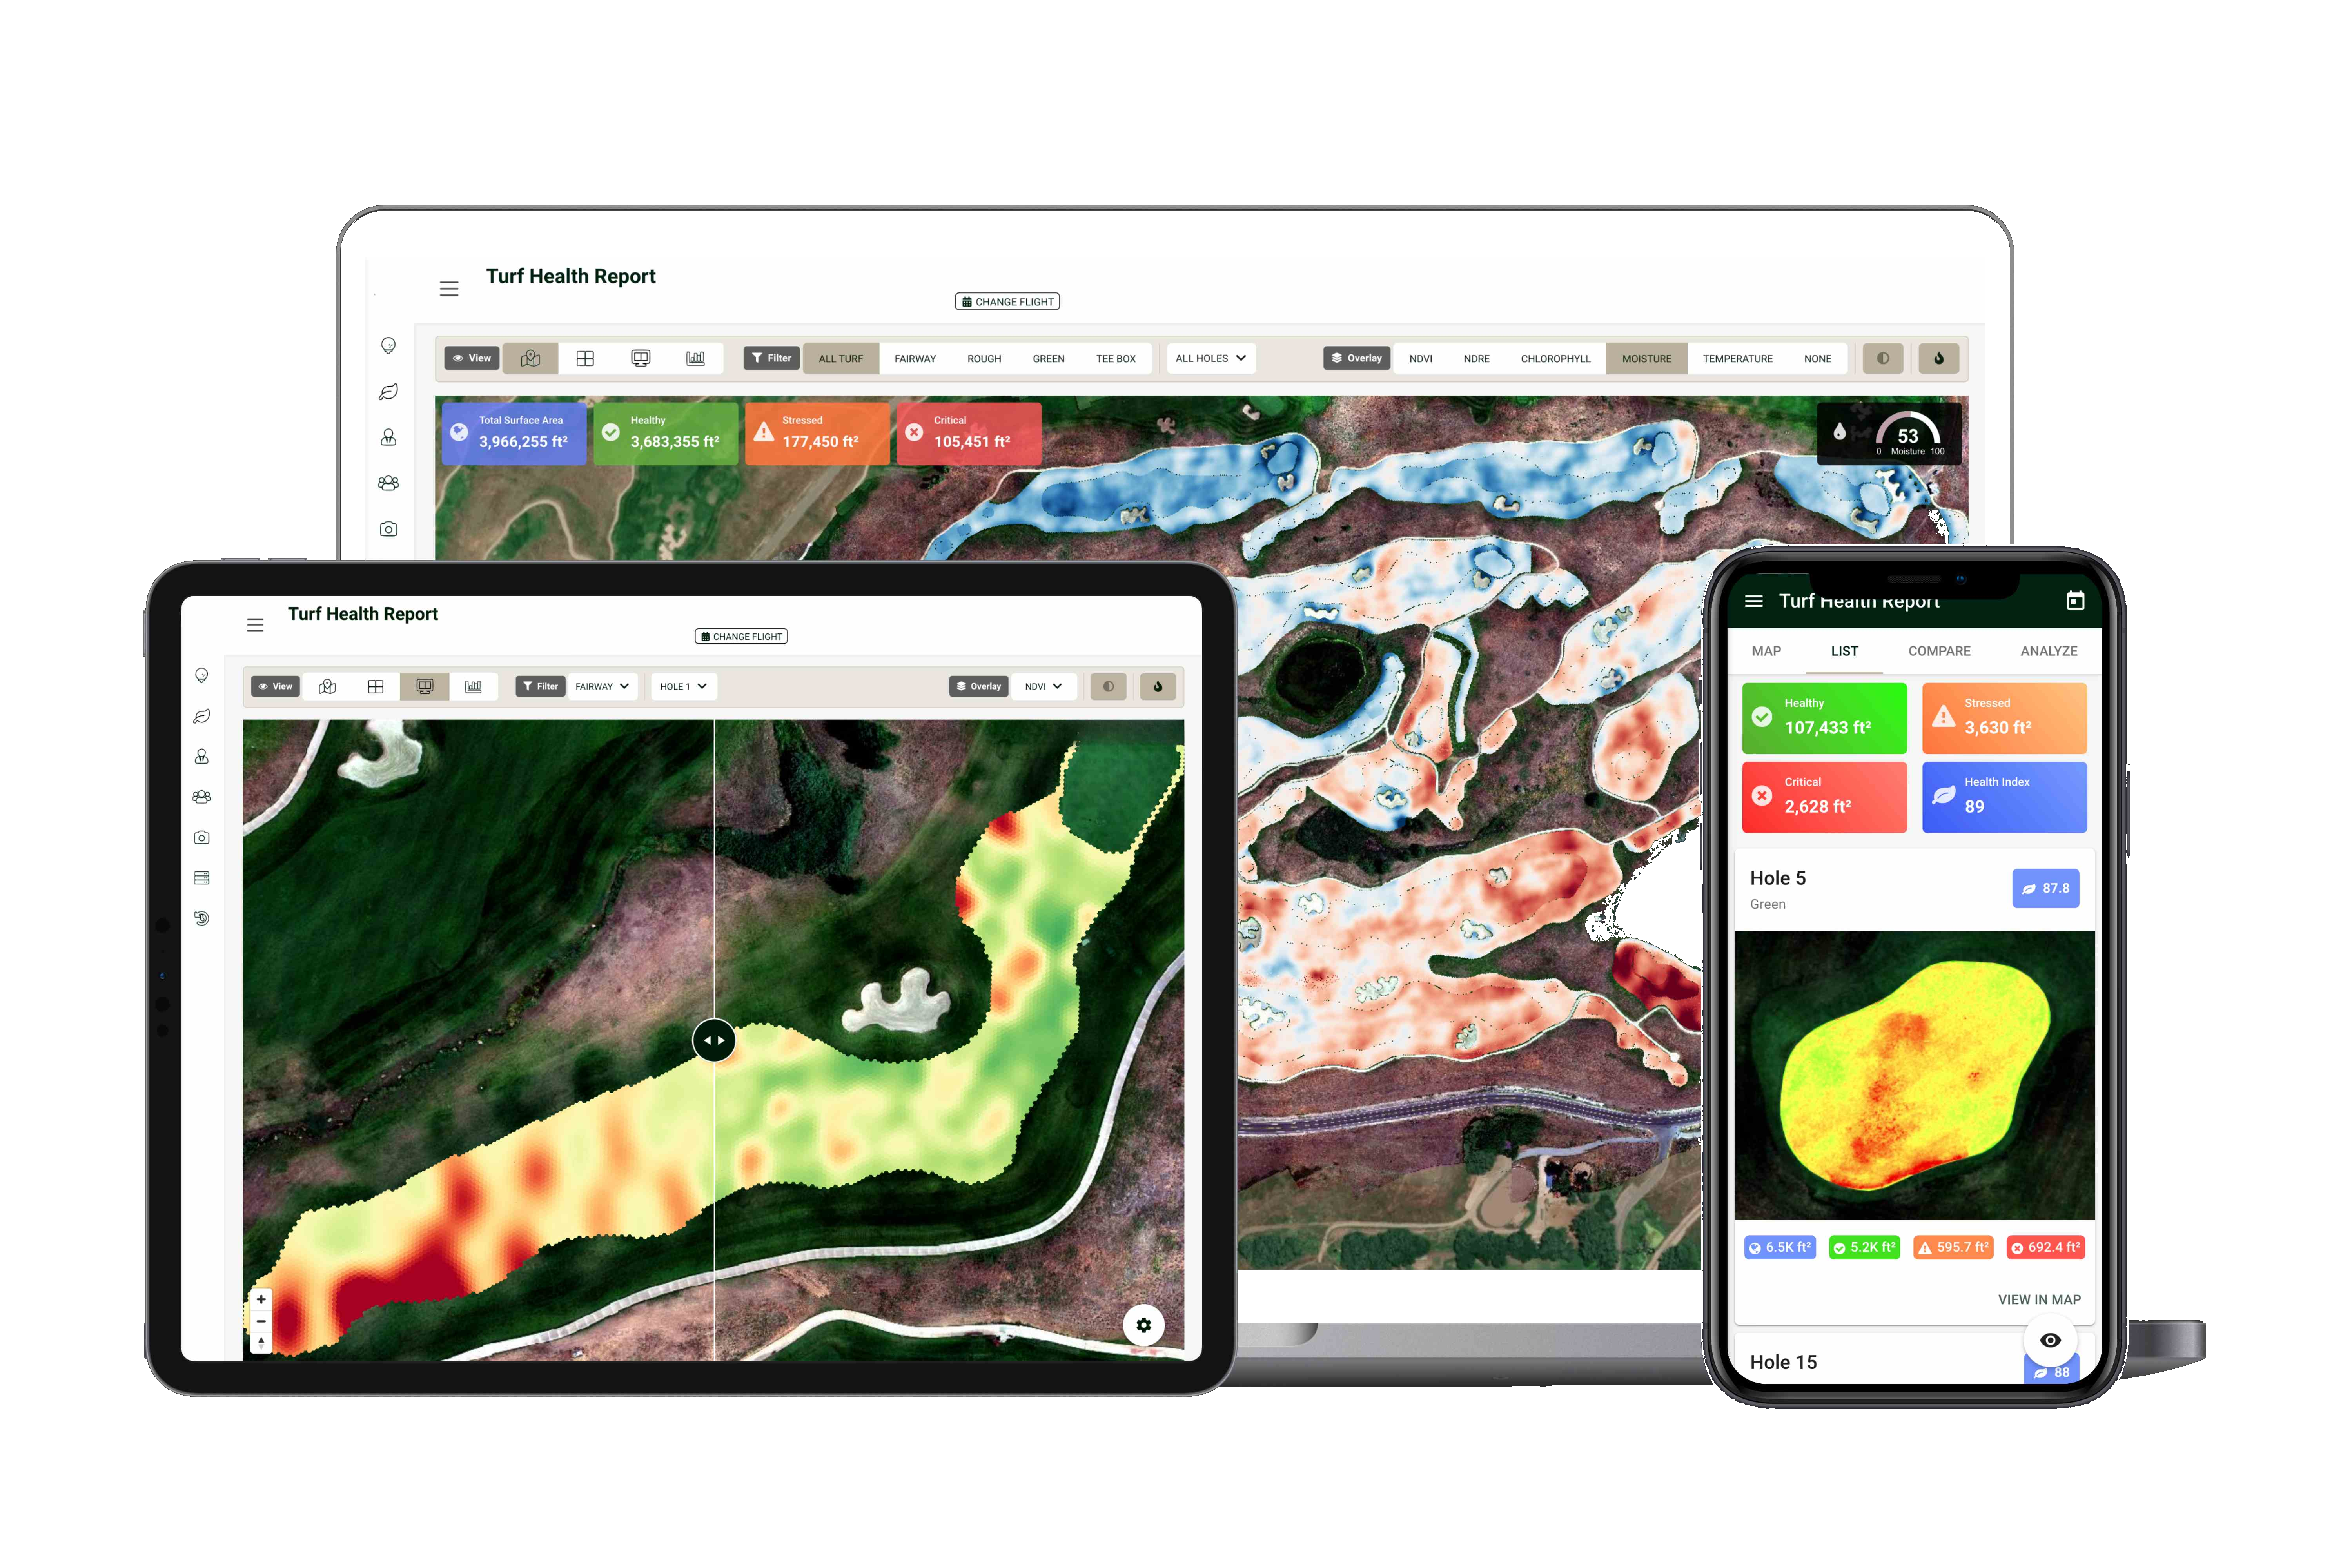
What You Receive After Every Flight
Each TurfSense report is structured for action in the field and confidence in the boardroom.
U.S. golf courses reported major long-term irrigation efficiency gains, reinforcing the value of precision turf interventions.
Source: GCSAA study summary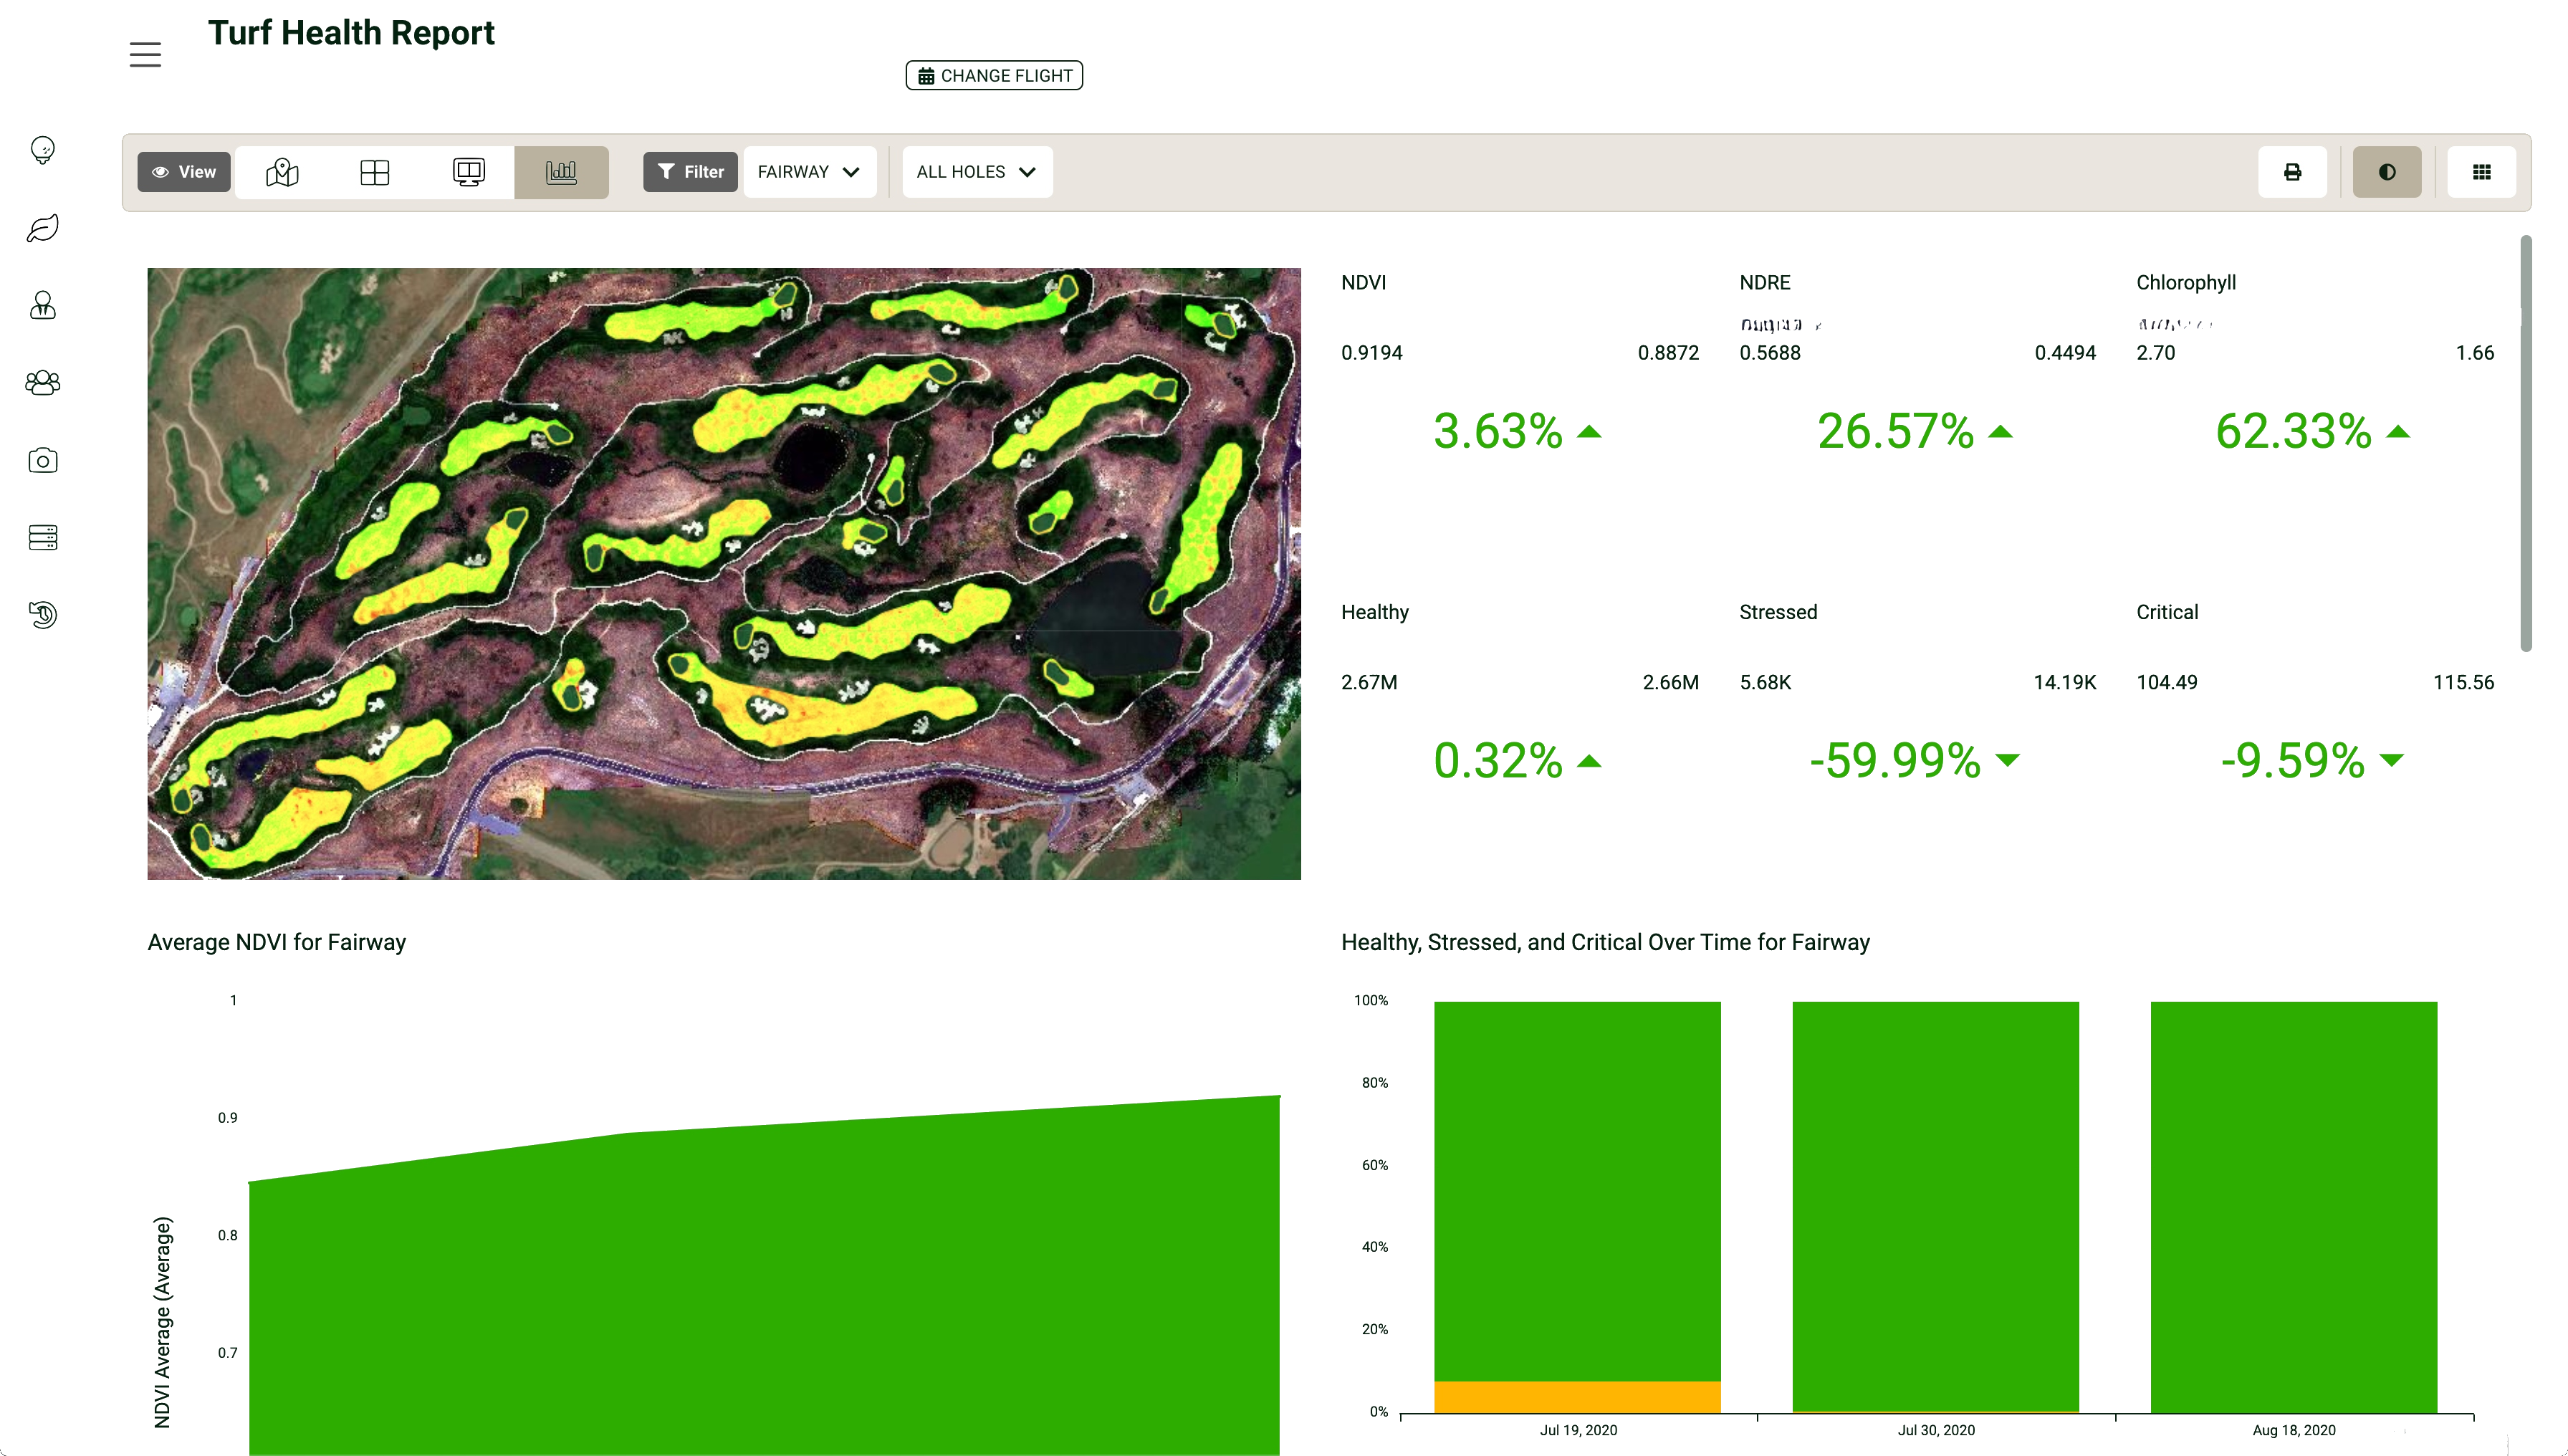
What Superintendents Say
"TurfSense detected stress on our 9th green five days before we would have seen it. That early warning saved us from a member complaint and costly remediation."
"The zone-priority maps changed how my crew operates. Instead of guessing, they know exactly where to focus each morning. We've cut inspection time by 40%."
"When our board asked about water usage, I had the data. TurfSense reports made it easy to show exactly where we saved and why our greens are consistently playable."
Cost of Inaction
Turf health issues become expensive when they stay invisible. TurfSense is built to expose loss early, prioritize intervention, and prove impact.
Teams spend time searching, verifying, and revisiting zones without quantified priority maps.
Uniform watering schedules over-serve healthy areas and under-serve stressed pockets.
Without auditable evidence, treatment decisions are hard to defend to boards and municipalities.
USGA business indicator reporting highlights sustained operational pressure on labor and maintenance budgets.
Source: USGA Green Section business indicatorsWho It's For
Protect member experience, optimize water use, and strengthen board reporting.
Keep public-use fields safer and more consistent through heavy footfall and weather swings.
Improve consistency and input precision where every square meter matters.
Detect stress events earlier and protect seasonal output quality.
How TurfSense Works
One operational workflow from capture to intervention and proof.
Certified pilots capture multispectral and thermal imagery with calibrated protocol.
Data is processed in Canadian infrastructure and transformed into actionable turf intelligence.
Your team receives zone-level priorities, intervention sequencing, and follow-up evidence.
Baseline complete and first intervention plan active.
Second scan validates trend movement and treatment response.
Operational cadence established with measurable performance reporting.
The Platform
Conversion benchmarks highlight the importance of clear offer structure, trust signals, and strong primary CTA hierarchy.
Source: Unbounce B2B conversion benchmark report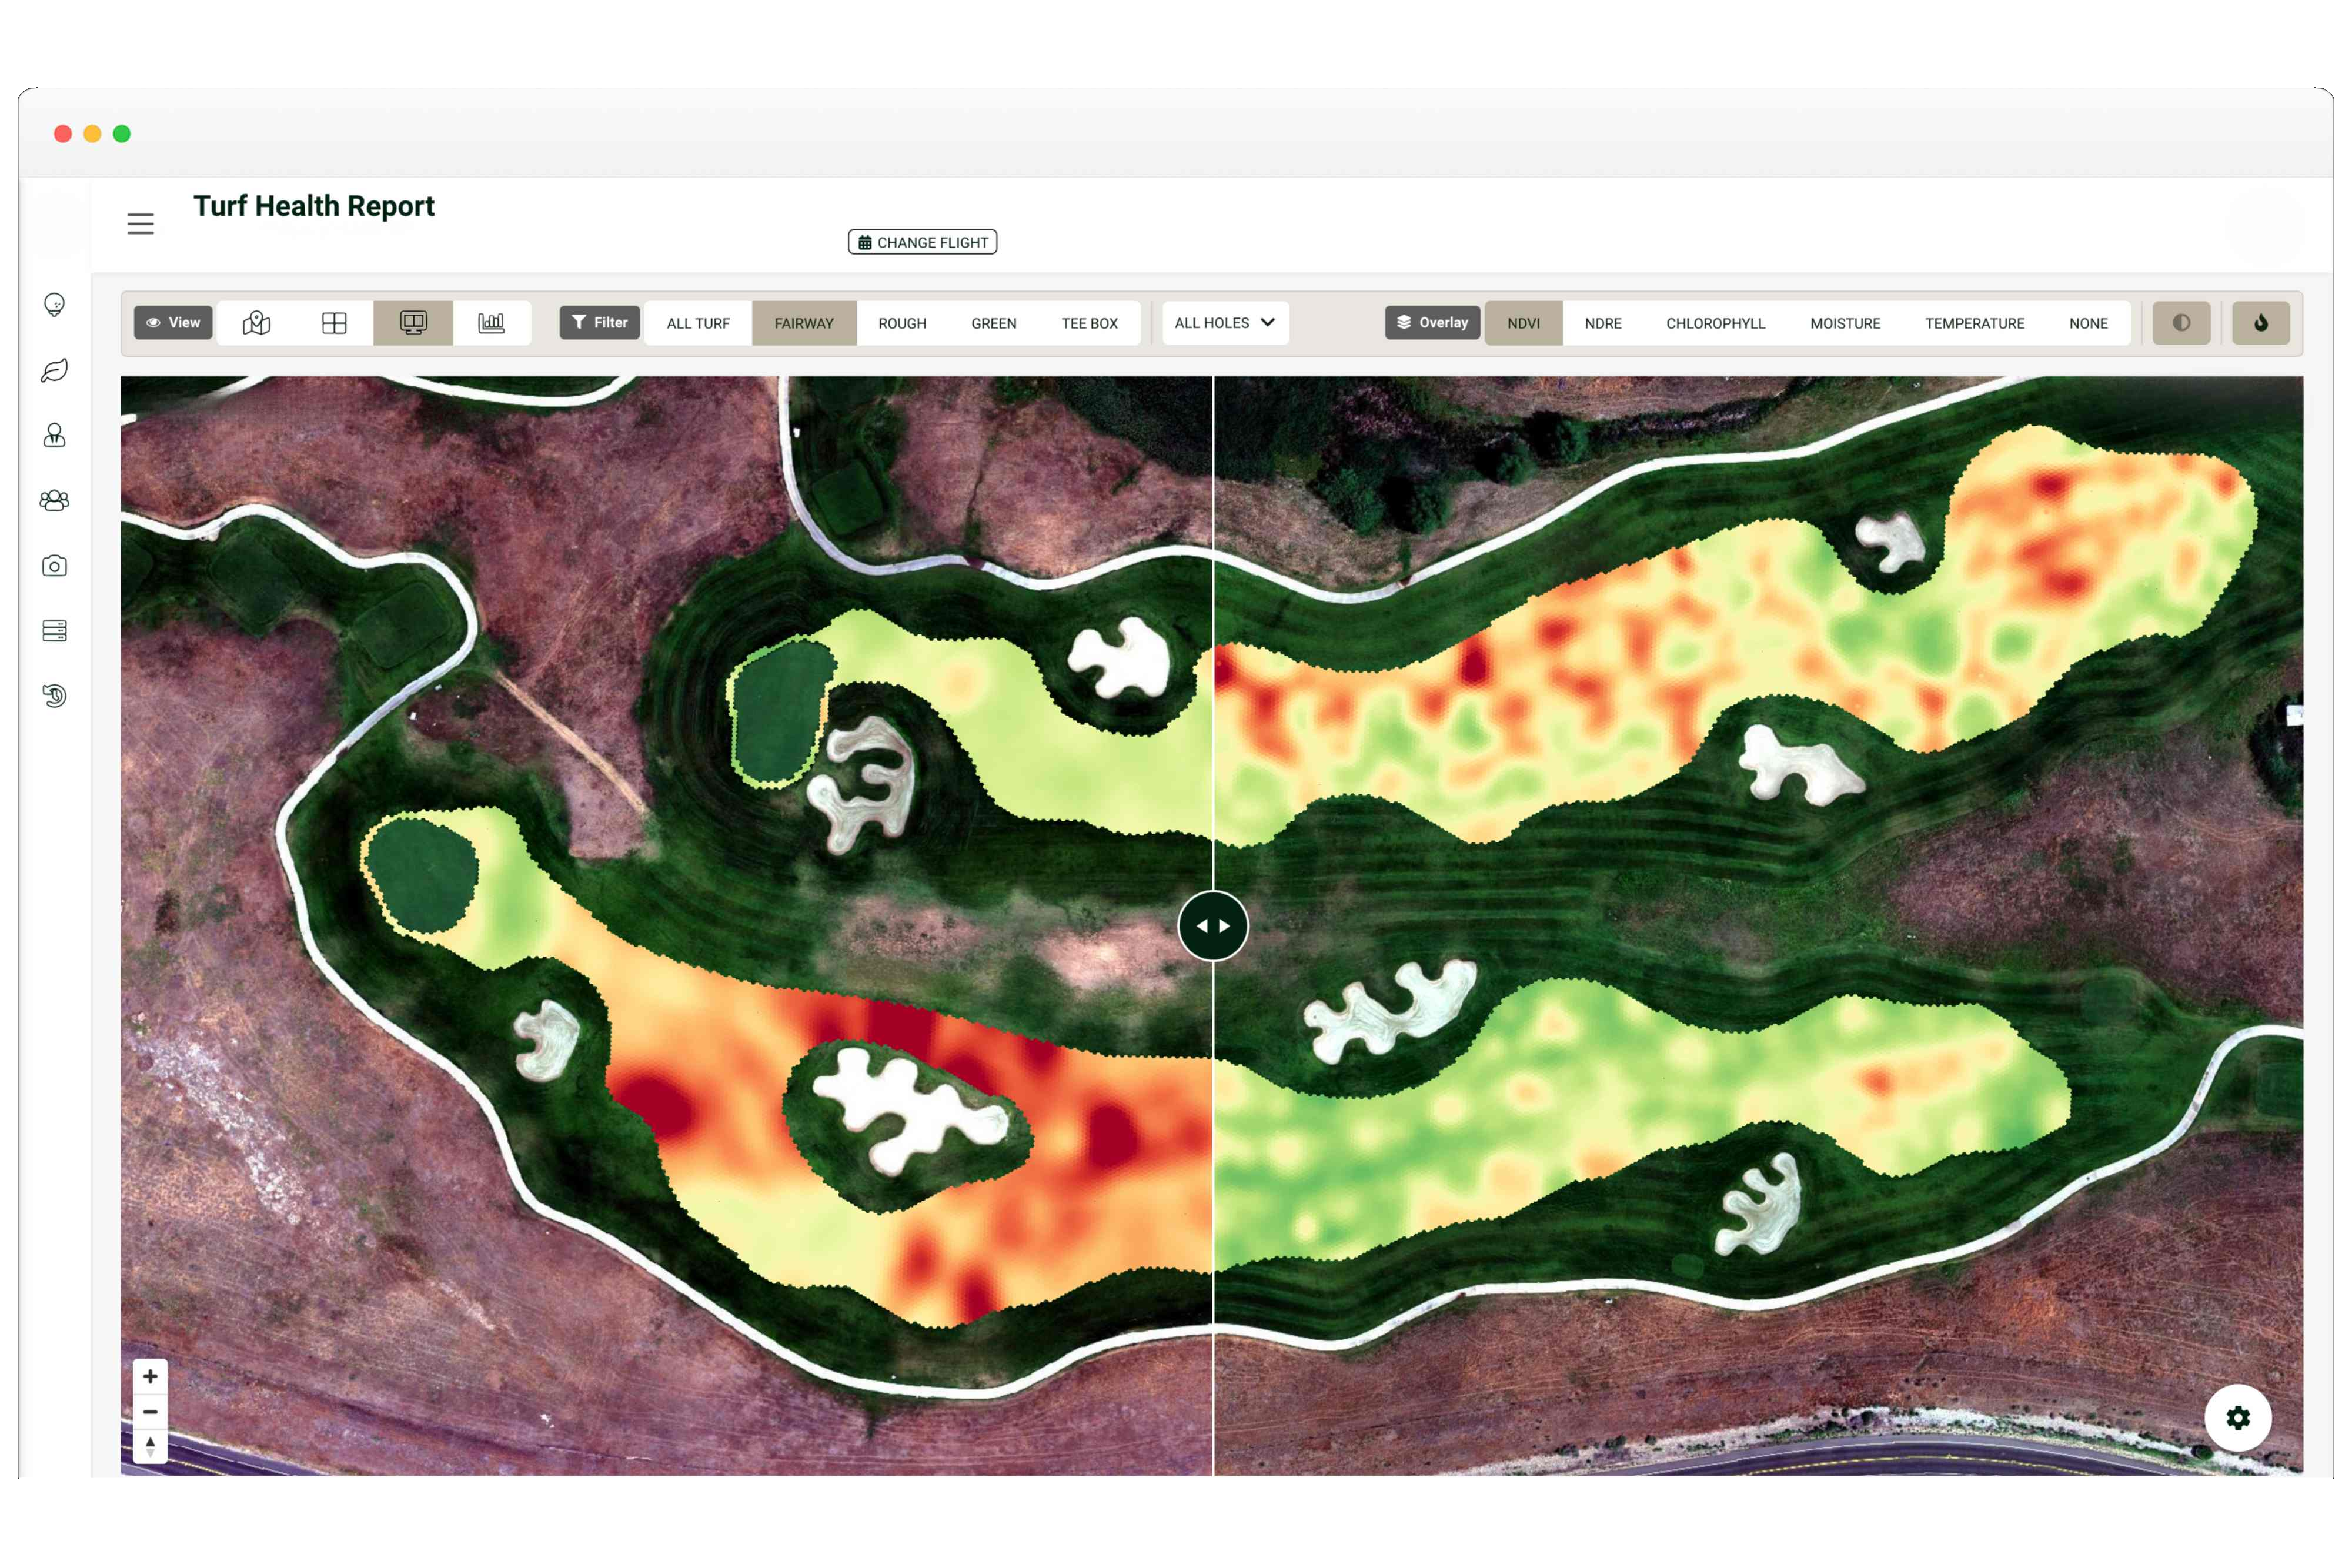
ROI Calculator
Enter your facility details to estimate annual savings from precision turf intelligence.
Superintendent Time Saved
$0
1 hour/day inspection reduction
Irrigation Savings
$0
15-25% precision targeting
Chemical Savings
$0
20-30% spot treatment
Estimated Annual Savings
$0
Your First 30 Days
Objectives, zones, operational constraints, and baseline setup.
Capture + processing + first intervention-ready report delivery.
Treatment priorities finalized with TurfSense specialist guidance.
Trend validation and cadence planning for ongoing optimization.
Pricing
Start with a pilot scan. Scale to seasonal or annual programs as you see results.
Starting at $1,500
One-time
Custom Quote
March - October
Custom Quote
Full Year
Case Study
Red Rock's superintendent was spending 4+ hours daily on course inspections. Despite the effort, stress events on greens were often caught too late, leading to member complaints and costly remediation.
TurfSense implemented biweekly multispectral scans covering all 18 greens, fairways, and tees. Zone-priority maps were delivered within 48 hours of each flight.
47%
Faster stress response
2.5 hrs
Daily inspection time saved
22%
Irrigation reduction
0
Member complaints in season
"The board now asks for the TurfSense report before every meeting. It's become our proof of performance."
— Michael Baxter, Superintendent
FAQ
No. TurfSense provides aircraft, sensors, pilots, processing, and reporting as one managed service.
Processing and storage are handled in Canadian regions (Montreal and Toronto) in the standard workflow.
ROI is tracked via reduced water/chemical/labor waste, faster intervention response, and trend-verified playability consistency.
Flights move to the next viable weather window and maintain continuity in the reporting cadence.
Pilot Scan CTA
Start with one pilot scan and get a decision-ready report your operations team and leadership can act on.
Book a Pilot Scan